New AI Tool Maps Urban Tree Canopy Using Aerial Imagery
USC researchers have published a canopy-mapping system in Remote Sensing that trades lidar for freely available USDA aerial imagery.
Shane Barrett·updated July 10, 2026
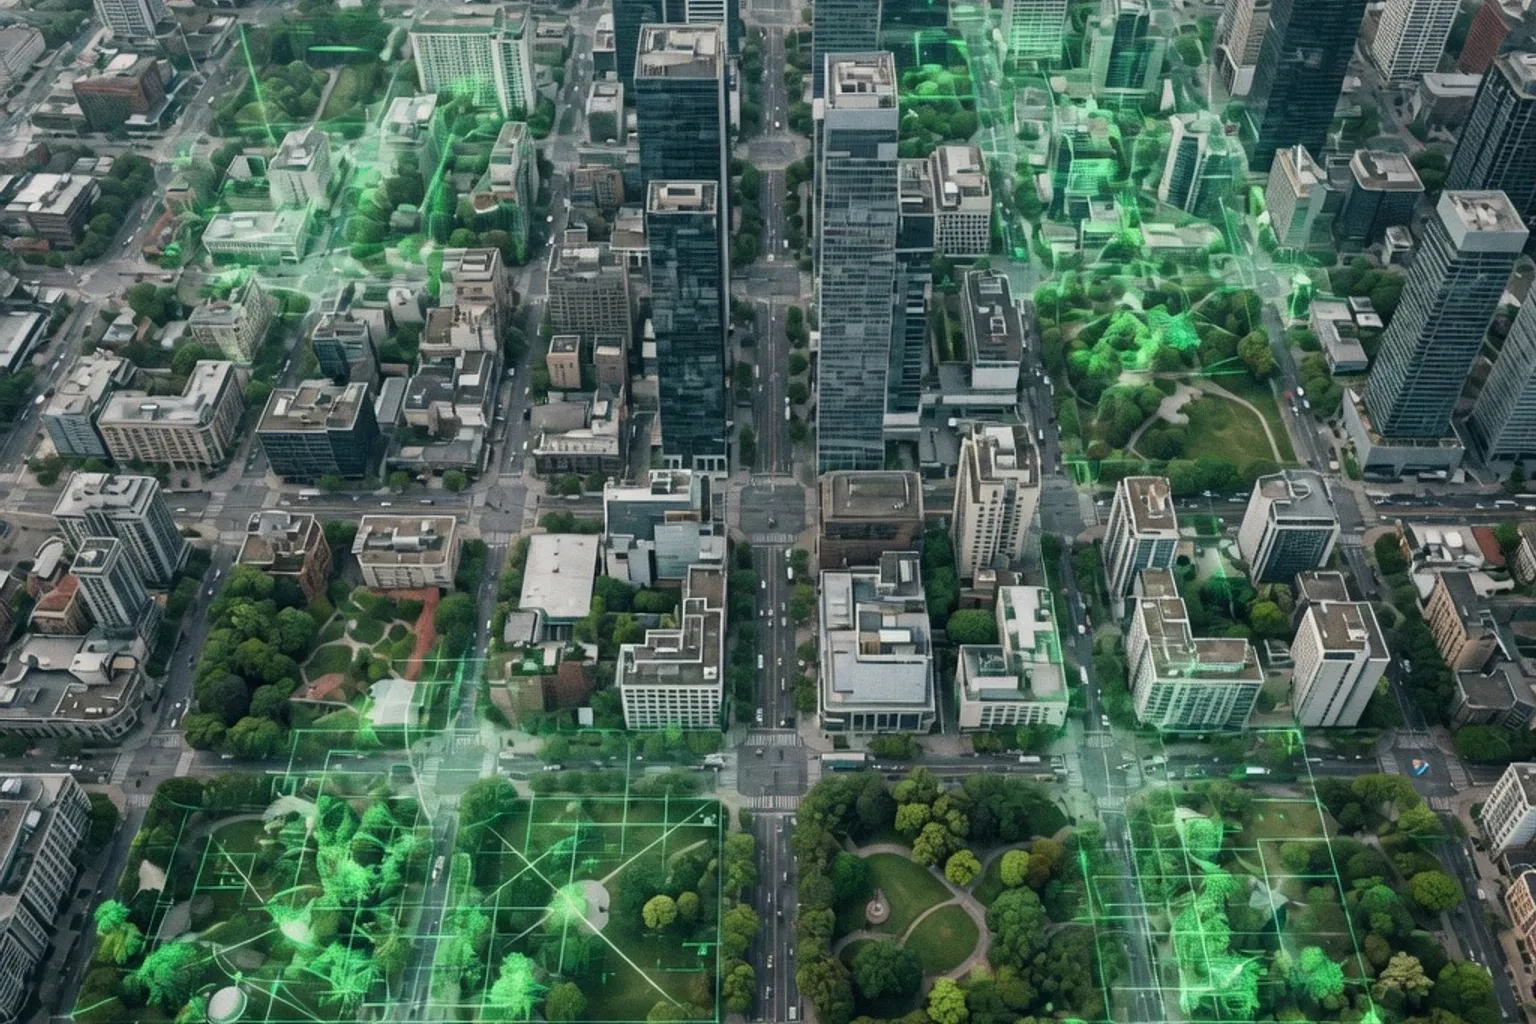
USC researchers have published a canopy-mapping system in Remote Sensing that trades lidar for freely available USDA aerial imagery. The model produces fine-scale tree cover maps at a fraction of conventional survey cost, tested on two dense Los Angeles neighborhoods. For ML practitioners working on geospatial segmentation, this is a data-sourcing case study worth inspecting: the pipeline demonstrates that public orthoimagery can compete with laser-scanning on downstream accuracy when paired with targeted architecture choices.
Architecture and Data Pipeline
The system ingests aerial photographs from the USDA National Agriculture Imagery Program—a dataset collected nationwide on a two-to-three-year cadence at no licensing cost. This replaces two standard inputs in urban canopy mapping: commercial satellite feeds and lidar point clouds, both of which carry significant per-kilometer acquisition expenses. The model performs two tasks: whole-image canopy segmentation and individual tree crown detection. The latter is the harder problem; tree crowns in aerial RGB imagery appear small and frequently overlap, creating ambiguous boundaries in the latent representation. The paper reports that the individual-tree model performed competitively with lidar baselines—a notable result given the input cost differential. However, "competitively" is doing load-bearing work here; exact benchmark numbers and confidence intervals require reading the full Remote Sensing publication for methodology and ablation details.
Evaluation Context and Limitations
Testing was confined to Boyle Heights and City Terrace—dense, majority-Latino neighborhoods east of downtown Los Angeles that are historically underserved by urban canopy. This choice is pragmatically motivated: these areas have well-documented urban heat island effects and existing municipal interest in targeted tree-planting investments. The limitation is clear. Generalization to different geographies—suburban sprawl, deciduous-dominated canopies in the Northeast, or cities with heavy shadow ocuration from tall structures—remains unproven. The USDA imagery itself introduces a temporal constraint: two-to-three-year refresh cycles mean the model operates on data that may be a full season behind ground truth. For any deployment, practitioners should treat the output as a planning signal, not real-time inventory.
What to Verify
Three points warrant direct inspection of the paper. First, the segmentation backbone and whether the authors conducted ablation studies on architecture components versus training data augmentation—this determines whether the accuracy gains are architecture-dependent or data-dependent. Second, the computational overhead relative to existing open-source canopy tools like i-Tree or DeepForest; a low-cost data pipeline is only useful if inference is also tractable on commodity hardware. Third, the labeling methodology: how ground-truth canopy masks were generated and at what resolution, since this directly affects reported IoU scores. The paper is published in Remote Sensing and should be available through standard academic channels.
The practical takeaway for applied ML teams: public-domain geospatial imagery is an underutilized training signal for semantic segmentation tasks beyond canopy mapping. Similar pipelines could apply to impervious surface detection, flood-risk modeling, or urban greenway planning—domains where lidar budgets are prohibitive but planning-grade accuracy still matters. Some vehicle manufacturers are already integrating similar spatial computing pipelines into software-defined vehicle architectures, underscoring the expanding demand for cost-efficient environmental perception models.