MLOps tooling: 5 factors driving pipeline efficiency
A slow pipeline is the kind of pain that creeps into a team's daily routine — an extra 20 minutes here, a flaky retry there, a serving cluster that scales five minutes after the traffic spike has already passed.
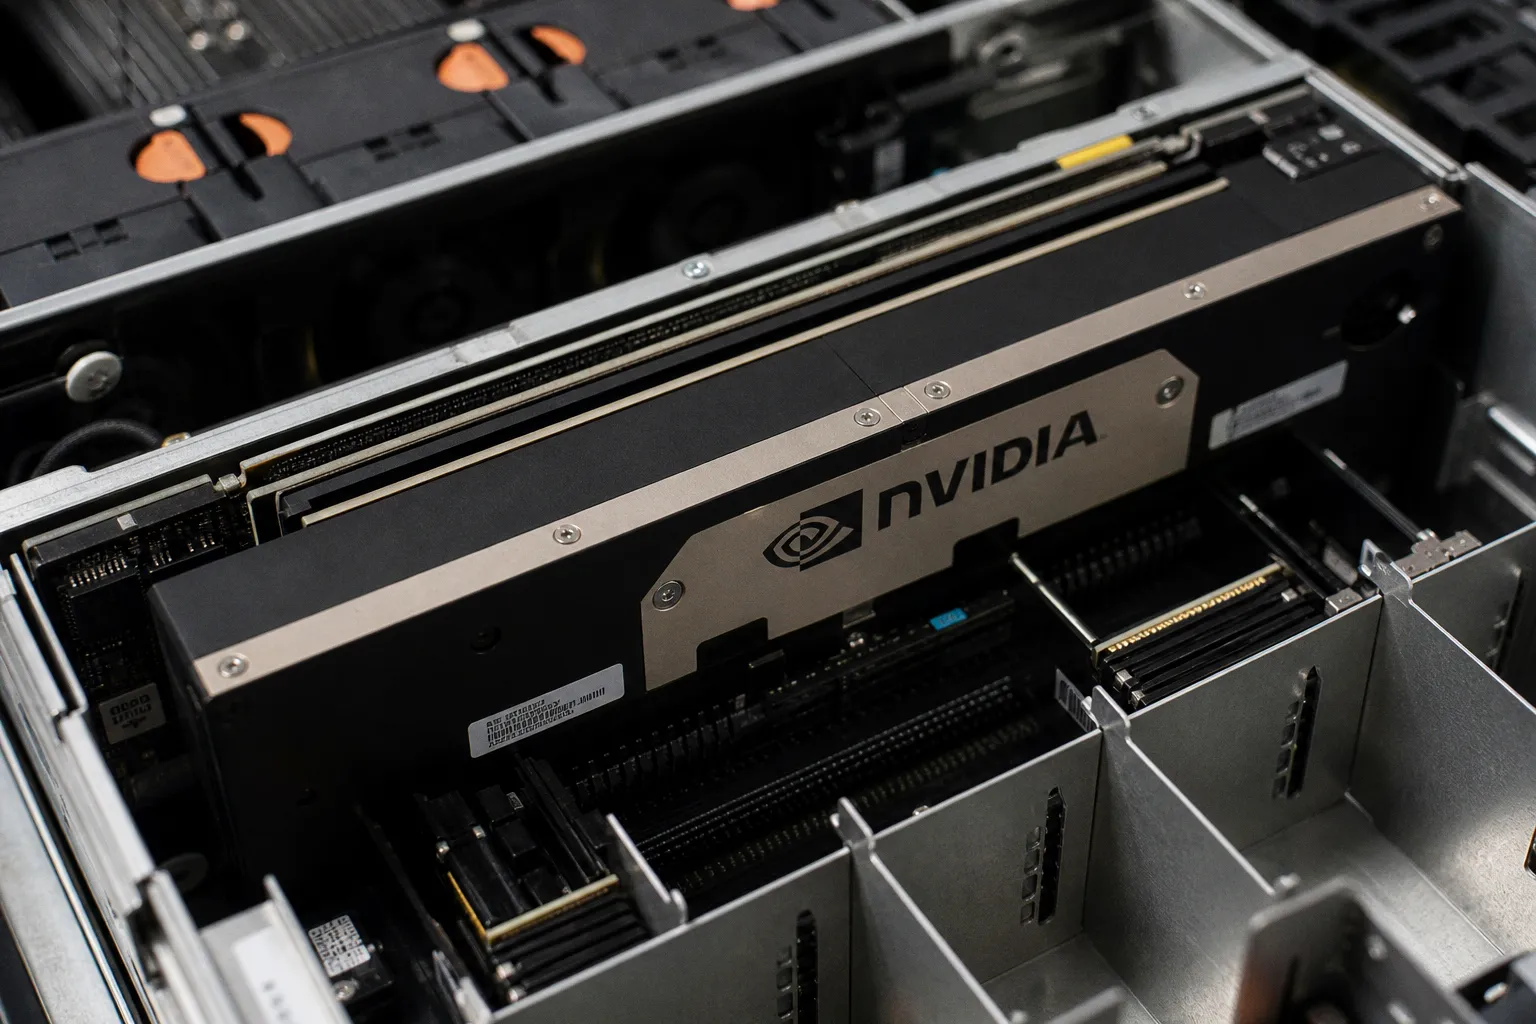
None of these moments feel catastrophic on their own. Together, they turn a workable ML platform into a system nobody trusts, and the blame usually lands on the wrong layer. We see this all the time — the model gets accused of being slow when the bottleneck is actually a missing cache, a single GPU held hostage by a low-priority job, or an autoscaler chasing the wrong signal. Good MLOps tooling won't magically rewrite a model, but it gives engineering teams a deterministic, measurable lever for every common failure mode — which is exactly what production needs.
Below, we walk through five efficiency levers that sit inside the open-source MLOps stack — Kubeflow Pipelines, Kubernetes GPU scheduling, Kubeflow Trainer, NVIDIA Triton, KServe, and MLflow — and the configuration knobs that actually move the needle. These aren't universal gains: every figure we cite depends on the workload, the cluster, and the SLOs you've committed to. Treat the numbers below as configuration references, not promises.
Pipeline efficiency isn't a single optimization — it's five independent levers, each with its own cache key, its own scheduling primitive, and its own failure mode.
1. Deterministic pipeline execution and caching strategies
The single most underused lever in Kubeflow Pipelines is also the cheapest: step-output caching. In the legacy KFP V1 SDK — still common in production because the final release was kfp==1.8.22 — caching is enabled by default for pipelines submitted through the backend and UI. That means if a component definition and its arguments exactly match a previous execution, the step gets skipped entirely. No container start, no retraining, no re-preprocessing.
The gotcha is in the word "exactly." Hash the component spec, the arguments, and the input signatures. If any of them drift — a floating-point default in a library upgrade, a timestamp injected as a parameter, a file path that resolves differently between runs — the cache key changes and the step re-runs. We have watched teams disable caching globally because they kept hitting cache misses they didn't understand, only to re-enable it after we helped them pin inputs and use static path templates.
Two configuration points matter:
- Cache staleness. You can set a maximum staleness window so cached outputs are reused only when they are recent enough for your data freshness requirements. There is no universal default — this depends entirely on how often your upstream data is refreshed and how stale a downstream consumer can tolerate.
- Migration to V2. The KFP documentation explicitly labels caching and resource controls as V1 mechanisms and recommends migration to the V2 SDK. If you're starting a new pipeline today, build on V2 from the start; if you're inheriting V1, plan the migration — the runtime semantics will keep moving.
Beyond caching, KFP exposes resource requests, node selectors, and retries as first-class configuration. Used together, they let you give expensive steps (heavy feature engineering, large-scale training) dedicated node pools while keeping cheap steps (validation, metric computation) on shared capacity. This isn't cache reuse in the strict sense — it's a related determinism gain: the same step, given the same inputs, lands on predictable hardware and runs in a predictable time.
2. GPU-aware scheduling and multi-node orchestration
Once you stop wasting cycles inside pipelines, the next bottleneck moves outside — onto the cluster that runs them. Kubernetes exposes GPUs through vendor device plugins, and the constraint is absolute: device-plugin resources are integer-only, cannot be overcommitted, and cannot be shared between containers. NVIDIA GPUs are typically advertised as nvidia.com/gpu. That single rule explains most of the cluster-level contention we see in practice: a workload that requests one GPU either gets exactly one whole GPU or sits in the queue.
This is where Kueue becomes valuable. Kueue's ClusterQueue can borrow quota or preempt running workloads when a ResourceFlavor lacks sufficient nominal quota — subject to the ClusterQueue or Cohort policy you configure. In plain terms, a high-priority training job can displace a low-priority notebook or a development pod, but only if you've drawn the priority boundary explicitly. We see teams set this up once, then forget that the policy is what enforces fairness — not Kubernetes' default scheduler.
For multi-node, multi-GPU jobs, Kubeflow Trainer is the orchestration layer worth wiring in. Its documentation states that it integrates with Kueue for topology-aware scheduling and offers a distributed data cache intended to stream data to GPU nodes with zero-copy transfer. The installation prerequisites documented in June 2026 require Kubernetes >= 1.31 and kubectl >= 1.31 — match those before you start, because the trainer control plane fails in opaque ways when the API surface drifts.
The pragmatic checklist before you scale distributed training:
- Confirm node-to-node bandwidth matches your gradient-sync volume. NVLink and InfiniBand behave very differently under NCCL.
- Decide whether your data loader is the bottleneck before assuming compute is. The distributed data cache only helps if your pipeline actually streams through it.
- Treat topology-aware scheduling as a configuration task, not a default. Topology hints that don't match your node group layout silently degrade to standard scheduling.
3. Optimizing throughput with dynamic request batching
Inference throughput and inference latency live in tension, and Triton's dynamic batching is the lever that explicitly trades one for the other. Dynamic batching combines individual incoming requests into a batch that's created on the fly — the server waits a short, configurable window, fills the batch, and processes it together. It is configured per model, with a preferred batch size list and a maximum queue delay.
A typical starting configuration looks like this:
| Parameter | Example value | What it controls |
|---|---|---|
preferred_batch_size | [4, 8] | Sizes the batcher tries to fill first |
max_queue_delay_microseconds | 100 | Upper bound on how long a request waits to be batched |
The numbers are deliberately small — 100 microseconds is well below human perception but meaningful for GPU dispatch overhead. Push max_queue_delay_microseconds higher only if your SLO has headroom; the longer the wait, the more chance a request gets batched, but the more tail latency you add.
The hard constraint is that dynamic batching targets stateless models. If your endpoint depends on stateful request sequences — multi-turn conversations, RNN state, partial decoding — you need Triton's sequence batcher instead. Trying to force stateful traffic through dynamic batching is a common source of subtle correctness bugs that only show up under load.
| Workload type | Right batcher |
|---|---|
| Stateless classifier or encoder | Dynamic batcher |
| Stateful sequence (RNN, decoder) | Sequence batcher |
| Streaming response | Neither — request a different serving pattern |
Don't claim dynamic batching reduces latency on every workload. It increases the batching opportunity at the cost of queue delay; on already-saturated traffic it can be neutral, and on lightly loaded traffic it adds latency for no throughput gain.
4. Scaling inference services with concurrency-based targets
KServe abstracts model deployment behind an InferenceService resource, and its control-plane API is where autoscaling decisions actually live. The two configuration points we tune most often:
minReplicas: defaults to 1. Setting it to 0 enables scale-to-zero — replicas drop to nothing during idle periods, costs drop with them, but cold-start latency takes the hit. For latency-sensitive endpoints, measure cold-start behavior before committing to scale-to-zero; for batch or asynchronous endpoints, it's almost always a win.- Autoscaling target: KServe supports concurrency, requests per second, CPU, or memory as the scaling signal. The right choice depends on what your model actually saturates on. GPU-bound transformer serving usually scales on concurrency (each replica can hold a bounded number of in-flight requests before queueing starts to bite); CPU-bound classical models often scale better on RPS.
A common gotcha — scaling on CPU when the bottleneck is GPU memory. The pod stays under the CPU target while the GPU is fully booked and requests start queueing inside Triton. The autoscaler never fires because the signal it watches is wrong. Pair the autoscaling target with a queue-depth or queue-latency signal wherever possible; that's where Triton's own metrics earn their keep.
The other configuration we keep coming back to is the request timeout and the retry budget. Both sit above KServe, in the gateway or service mesh, but they determine whether a slow inference replica triggers a scale event or a cascade of retries that swamp the next pod. We treat these as part of the serving tier, not the network tier — they're an MLOps concern.
5. Modernizing model lifecycle management beyond legacy stages
The last lever is the one most teams leave on the table: model registry semantics. MLflow deprecated model lifecycle stages (Staging, Production, Archived) in version 2.9.0, with removal planned for a future major release. The current recommended workflow is aliases and tags — aliases can be reassigned independently of production code, while tags can record validation status such as pending, passed, or failed.
Why this matters for efficiency: stages coupled a model's lifecycle to the registry's bookkeeping, which meant promotion was a write to the registry and demotion was a rollback of code and data. With aliases, production is a pointer you can move atomically, and the validation status lives in tags that any pipeline stage can read or write. Promotion becomes a control loop with a clear audit trail — pass validation, set the tag, reassign the alias — instead of a write that triggers a deploy. To consume it, downstream code resolves the alias through MLflow's model-version-by-alias API and gets back one concrete ModelVersion to deploy — alias resolution is a pointer lookup, not a search.
The practical migration path:
- Resolve the production model through MLflow's alias-specific registry API (e.g.,
client.get_model_version_by_alias(name, "production")) rather than treatingaliasas a generic search-filter field — alias resolution returns a single concreteModelVersion, not a result set to filter through. - Keep the staging environment as a separate deployment — don't conflate "the staging cluster" with "the staging MLflow stage."
- Use tags to record validation evidence (test suite ID, eval scores, signer) so audits are readable from the registry alone.
This is one of those refactors that doesn't change throughput or latency directly — but it removes a class of rollout incidents that consume engineering time every quarter. That time is the real efficiency gain.
Putting the five levers together
These five levers — deterministic pipeline caching, GPU-aware scheduling and preemption, dynamic batching, concurrency-driven autoscaling, and alias-based model promotion — are configuration-level controls, not universal accelerators. Each one is exposed by a specific tool, configured per workload, and tied to a measured SLO. That structure is the point: pipeline efficiency in MLOps tooling is a property of your configuration as much as your code.
| Lever | Primary tool | Configuration that matters | Failure mode to watch |
|---|---|---|---|
| Pipeline caching | Kubeflow Pipelines | Cache key exactness, staleness window | Drifting inputs invalidating the cache |
| GPU scheduling | Kueue + device plugins | ClusterQueue borrowing/preemption policy | Quota starvation across teams |
| Multi-node training | Kubeflow Trainer | Topology hints, distributed data cache | Data loader as the real bottleneck |
| Inference batching | Triton | preferred_batch_size, max_queue_delay_microseconds | Stateful traffic through dynamic batcher |
| Lifecycle | MLflow | Aliases resolved via get_model_version_by_alias, not stages | Stale Staging deployments masquerading as Production |
A clean rule of thumb we've landed on after running these stacks: pick one lever per quarter, instrument it, and write down the workload-specific number you measured. Repeat. Six months in, you'll have a configuration reference that's actually defensible — and a platform the team trusts.